What is Simple Moving Average (SMA)
- ▶<span lang="EN-US" dir="ltr"><strong>How Does Simple Moving Average (SMA) Works?</strong></span><strong> </strong>
- ▶<span lang="EN-US" dir="ltr"><strong>Calculation of Simple Moving Average </strong></span><strong> </strong>
- ▶<span lang="EN-US" dir="ltr"><strong>Factors to Consider When Using Simple Moving Average (SMA)</strong></span><strong> </strong>
- ▶<span lang="EN-US" dir="ltr"><strong>Benefits & Limitations of Simple Moving Average</strong></span><strong> </strong>
- ▶<span lang="EN-US" dir="ltr"><strong>Trading Strategies Using Simple Moving Average</strong></span><strong> </strong>
- ▶<span lang="EN-US" dir="ltr"><strong>Conclusion</strong></span><strong> </strong>
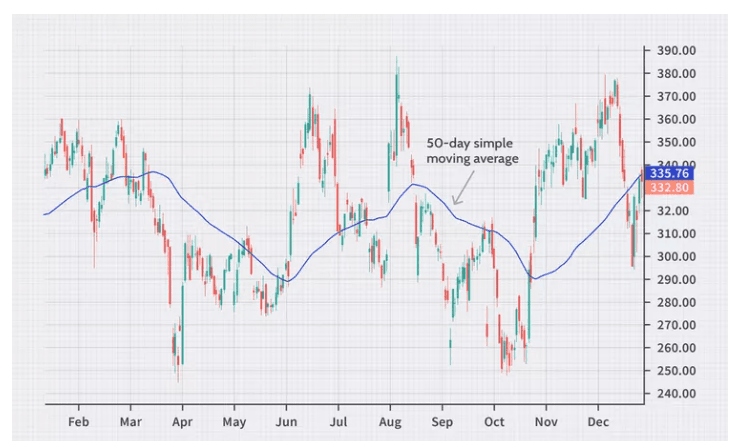
A Simple Moving Average (SMA) is a technical indicator that measures a stock's average price over a given time period. SMA full form in stock market is Simple Moving Average, which is frequently used to determine the overall direction of price movement. Instead of concentrating on daily price swings, traders examine how the average price changes over time while measuring SMA in stock market. This method helps in analysing more general market trends. Additionally, the indicator helps traders better understand market activity by pointing out possible areas of support or resistance.
Note: Refer this Image as we need to create image like this.
How Does Simple Moving Average (SMA) Works?
The Simple Moving Average calculates a stock's average price over a predetermined number of trading periods. It is constantly updated with new price information.
- Calculating the Average Price: SMA is calculated by adding a stock's closing prices over a selected time and dividing the result by that amount. This calculation is known as the simple moving average formula.
- Smoothing Prices: By reducing short-term price swings and producing a smoother price line, the indicator improves the analysis of the trend.
- Identification of Trends: A rising trend may be indicated if the stock price stays above the SMA line. A downward trend may be indicated if the price remains below the SMA line.
- Constant Modification: The most recent price is added to the calculation, and the oldest price is subtracted as new trading sessions take place. As a result, the average remains in line with the direction of the market.
- Example of Simple Moving Average: Assume stock records closing prices of ₹100, ₹102, ₹104, ₹106, and ₹108 over five days.
SMA = \frac {100 + 102 + 104 + 106 + 108}{5} = 104
The five-day SMA of the stock price in this example is ₹104.
Note: Refer this Image as we need to create image like this.
Calculation of Simple Moving Average
Calculating the simple moving average (SMA) involves adding the security's price over a certain duration and dividing the number of periods. For instance, the SMA of a stock's monthly closing prices is calculated by adding the closing price of each trading day and dividing the total by the number of trading days in that month.
The formula for calculating the SMA is:
SMA = (A1 + A2 + A3 + ... + AN) / N
In this formula, AN represents the asset's price at period N, and N represents the total number of periods.
Let's consider a case study using HDFC Bank Ltd's closing prices over 10 days:
Week One (5 trading days): 1200, 1210, 1240, 1235, 1220. Week Two (5 trading days): 1220, 1200, 1205, 1205, 1200
If we want to calculate the 5-day moving average, we would take the sum of the closing prices for the first 5 days and divide it by 5:
(1200 + 1210 + 1240 + 1235 + 1220) / 5 = Rs. 1221
The 5-day SMA for HDFC Bank Ltd is Rs. 1221.
Comparing the current market price with the 5-day moving average is helpful when making trading decisions. For instance, if HDFC Bank's closing price on Day 6 is Rs. 1220, lower than the 5-day simple moving average, this suggests a possible bearish signal.
Factors to Consider When Using Simple Moving Average (SMA)
To precisely interpret signals while using SMA in stock market analysis, traders frequently consider several factors.
1. Choosing a Time Period
The speed at which the SMA responds to price fluctuations depends on the selected time frame. While longer periods show more general market movements, shorter periods react more quickly.
2. Volatility of the Market
Prices may regularly breach the SMA line in extremely volatile markets. Before reading signals, traders should take market volatility into account.
3. Timeframe for Trading
Different SMA periods are needed for different trading techniques. Short-term traders may utilise shorter averages, whereas long-term investors frequently favour longer averages.
4. Utilise Additional Indicators
SMA is typically used along with other technical indicators to confirm signals improve analytical reliability.
5. Quality of the Asset
Different assets may exhibit different price trends. Traders usually modify SMA periods based on the asset's historical performance.
Benefits & Limitations of Simple Moving Average
Simple Moving Average is often used because it makes trend analysis easier. But it also has some drawbacks.
Benefits of Simple Moving Average | Limitations of Simple Moving Average |
| Helps identify the general direction of market trends | Signals may lag because the indicator uses past price data |
| Smooths short-term price fluctuations | May produce misleading signals in sideways markets |
| Easy to calculate and interpret | Gives equal importance to all price data in the selected period |
| Useful for recognising potential support and resistance areas | Slow reaction to sudden market price changes |
| Widely used in technical analysis strategies | Works more effectively when combined with other indicators |
Trading Strategies Using Simple Moving Average
To evaluate price fluctuations and make trading decisions, traders employ a variety of strategies based on what is SMA in stock market analysis.
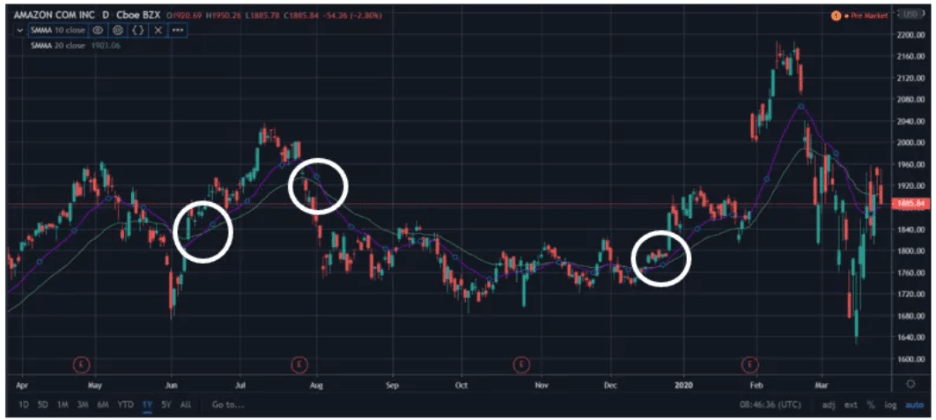
1. Crossover Strategy for Moving Averages
Two SMAs with distinct time periods are used in this strategy. When the shorter SMA crosses above the longer SMA, a buy signal appears, and when it crosses below it, a sell signal appears.
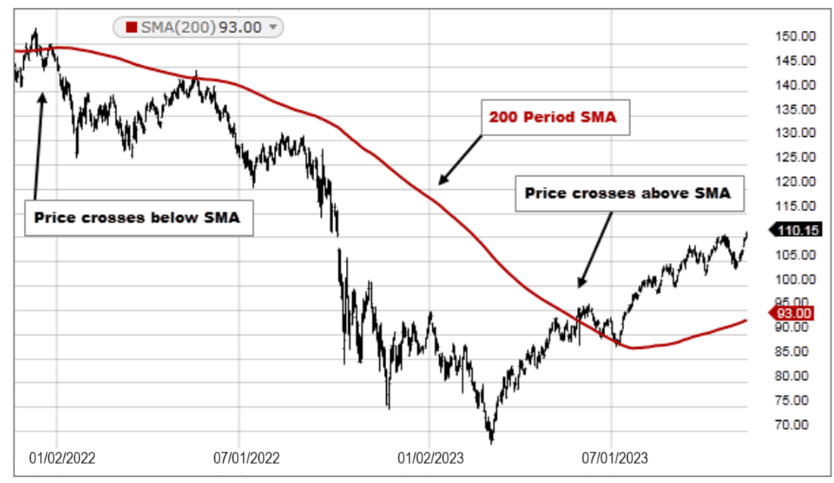
2. Trend-Following Approach
Traders keep track to see whether the price remains above or below the SMA line. An upward trend may be indicated by persistent movement above the SMA.
3. Observation of Support and Resistance
SMA frequently serves as a dynamic support or resistance level in trending markets. When prices go close to the moving average, traders observe how they respond.
4. The Multiple Moving Average Approach
On a single chart, some traders plot many SMAs from various time periods. This helps in determining potential trend reversals and understanding the strength of trends.
5. Strategy for Breakout Confirmation
Price breakdowns can be verified with the use of SMA. Stronger trend confirmation may be seen by traders if the price rises over a critical level and stays above the moving average.
Note: Refer this Image as we need to create image like this.
Conclusion
A Simple Moving Average (SMA) trading strategy is a popular technical analysis approach in financial markets. It involves calculating the average price of an asset over a specific period, such as 50 days or 200 days, and using it as a reference point for making trading decisions. Traders commonly use the crossover of shorter-term SMAs (e.g., 50-day) with longer-term SMAs (e.g., 200-day) to identify potential buy or sell signals. SMA trading strategies aim to capture trends and smooth out price fluctuations, helping traders make informed decisions based on historical price patterns. Platforms like BlinkX offer comprehensive tools and features, empowering traders to implement SMA strategies easily and efficiently. Additionally, beginners who want to understand trading can explore the user-friendly BlinkX trading app, which offers online support and guidance.
- BlinkX launches ItsATraderThing Campaign
- blinkX Introduces 'Options Watchlist' to Empower Traders with Real-Time Insights
- BlinkX Enhances Trading with 24/7 Customer Support Capabilities
- Unlocking Seamless Trading: Introducing “Order Slicing” For The FnO Market
- A Game-Changer for Traders: Introducing Horizontal Watchlists
FAQs on Simple Moving Average (SMA)
What is a simple moving average trading strategy?
A simple moving average trading strategy is used in financial markets to calculate an asset's average price over a specified period to identify trends and make trading decisions.
How does a simple moving average trading strategy work?
In a simple moving average trading strategy, a predetermined number of past prices are added together and divided by the number of periods to calculate the average, which is then plotted on a chart to determine to buy and sell signals based on price crossovers.
What is the significance of a simple moving average in this strategy?
The simple moving average is a smoothing tool that helps traders identify trends and potential reversal points by reducing short-term price fluctuations and providing a clearer picture of the overall market direction.
What common periods are used in a simple moving average trading strategy?
Traders often use periods such as 50-day, 100-day, or 200-day simple moving averages, depending on their trading style and the asset they are analyzing.
Are there variations of the simple moving average trading strategy?
Yes, variations of the simple moving average trading strategy include using multiple moving averages with different periods to generate more precise trading signals, such as the crossover of a shorter-term moving average with a longer-term moving average.